Recherche dans les scripts pour "macd divergence"

MACD Divergence MultiTimeFrame [FantasticFox]This is a MACD divergence on 3 time-frames, 1h, 4h and 1D.
Please insert the indicator into a 1h chart, otherwise change the lengths' inputs.
you will see H1,H2, H3, R1, R2 and R3 in green and maroon colors.
H means hidden divergence, 1 regards to 1h, 2 to 4h, and 3 to 1D. If the color is green, its bullish, and if its maroon the divergence is bearish.
Gray circles on 4h macd is for those traders who want to check the confirmation on Elliott wave changes.
*Thanks to RicardoSantos MACD divergence.

[RS]MACD Divergence V0EXPERIMENTAL:
MACD Divergence detection.
looks like macd is more prone for missing the extremes in price then the rsi due to lag.

MACD Divergence all in oneMACD Divergence all in one
It can also be named as MACD dual divergence detector pro !
A sophisticated yet user-friendly tool designed to identify both bullish and bearish divergences using the MACD (Moving Average Convergence Divergence) indicator. This advanced script helps traders spot potential trend reversals by detecting hidden momentum shifts in the market, offering a comprehensive solution for divergence trading.
🎯 Key Features:
• Automatic detection of bullish and bearish divergences
• Clear visual signals with color-coded lines (Green for bullish, Red for bearish)
• Smart filtering system to eliminate false signals
• Customizable parameters to match your trading style
• Clean, uncluttered chart presentation
• Optimized performance for real-time analysis
• Easy-to-read labels showing divergence types
• Built-in signal spacing to avoid clustering
📊 How it works:
The indicator uses an advanced algorithm to analyze the relationship between price action and MACD momentum to identify:
Bullish Divergences:
- Price makes higher lows while MACD shows lower lows
- Signals potential trend reversal from bearish to bullish
- Marked with green lines and upward labels
Bearish Divergences:
- Price makes lower highs while MACD shows higher highs
- Signals potential trend reversal from bullish to bearish
- Marked with red lines and downward labels
⚙️ Customizable Settings:
1. MACD Parameters:
- Fast Length (default: 12)
- Slow Length (default: 26)
- Signal Length (default: 9)
2. Divergence Detection:
- Left/Right Pivot Bars
- Divergence Lookback Period
- Minimum/Maximum Divergence Length
- Divergence Strength Filter
3. Visual Settings:
- Clear color coding for easy identification
- Adjustable line thickness
- Customizable label size
💡 Best Practices:
- Most effective on higher timeframes (1H, 4H, Daily)
- Combine with support/resistance levels
- Use with trend lines and price action
- Consider volume confirmation
- Best results during trending markets
- Use appropriate stop-loss levels
🎓 Trading Tips:
1. Look for bullish divergences near support levels
2. Watch for bearish divergences near resistance zones
3. Confirm signals with other technical indicators
4. Consider market context and overall trend
5. Use proper position sizing and risk management
⚠️ Important Notes:
- Past performance doesn't guarantee future results
- Always use proper risk management
- Test settings on historical data first
- Different timeframes may require parameter adjustments
- Not all divergences lead to reversals
Created by: Anmol-max-star
Last Updated: 2025-02-25 16:15:08 UTC
📌 Regular updates and improvements planned!
Disclaimer:
This indicator is for informational purposes only. Always conduct your own analysis and use proper risk management techniques. Trading involves risk of loss, and past performance does not guarantee future results.
🤝 Support:
Feel free to leave comments for:
- Suggestions
- Improvements
- Feature requests
- Bug reports
- General feedback
Your feedback helps make this tool better for everyone!
Happy Trading and May the Trends Be With You! 📈
MACD + Divergence + Line █ OVERVIEW
Here's the classic MACD with some simples features in plus.
█ CONCEPTS
4 features
1 — Classic MACD histogram, with 4 different colors such as above or below 0, and above or below the previous bar
2 — Display option to disable EMA
3 — A signal line that show the exact point, because the histogram view might be hard to be precise
4 — Looking for previous Divergences, Bullish, Bearish and Hidden Bullish and Bearish but I don't like Hidden divergences
█ OTHER SECTIONS
An oscillator is good to know where we are in the trends, but it's not enough to run a small business of trading, you need to learn how to use it.
What is a divergence ?
Thanks to The rational investor for teaching me how to use this indicator.
MACD Divergence Optimizer# MACD Divergence Optimizer - User Guide
## Overview
The **MACD Divergence Optimizer** is a professional-grade technical analysis indicator for TradingView that automatically detects hidden divergences on MACD with volume weighting. It identifies potential reversal points before price action confirms the move, giving traders an early edge.
---
## What is Divergence?
A **divergence** occurs when price and an oscillator (like MACD) move in opposite directions:
- **Bullish Divergence**: Price makes a lower low, but MACD makes a higher low → Potential uptrend reversal
- **Bearish Divergence**: Price makes a higher high, but MACD makes a lower high → Potential downtrend reversal
Divergences are among the most reliable reversal signals in technical analysis.
---
## Indicator Features
### Volume-Weighted MACD
- Standard MACD is calculated on closing price
- This indicator uses **volume-weighted closing prices** for greater accuracy
- Formula: MACD = (Volume-Weighted EMA₁₂ - Volume-Weighted EMA₂₆)
- Volume weighting gives more importance to high-conviction price moves
### Automatic Swing Detection
- Detects local highs and lows (5-bar lookback)
- Tracks the last 5 swings for divergence analysis
- Only meaningful swings are tracked (filtered for noise)
### Smart Signal Generation
- Green triangle (▲) = Bullish Divergence (BUY signal)
- Red triangle (▼) = Bearish Divergence (SELL signal)
- Triangles appear directly on the MACD line for precise entry timing
### Built-in Alerts
- Real-time notifications for divergence signals
- Alerts can trigger mobile push notifications or sound
- Never miss a trading opportunity
---
## How to Use
### Installation
1. Open TradingView and navigate to the Chart
2. Click "Indicator" → Search "MACD Divergence Optimizer"
3. Click "Add to Chart"
4. The indicator appears in a separate panel below the price chart
### Reading the Indicator
**MACD Panel displays:**
- **Blue Line** = MACD (fast momentum)
- **Orange Line** = Signal line (slow momentum)
- **Histogram** (colored bars) = Difference between MACD and Signal
- Green bars = MACD above signal (bullish)
- Red bars = MACD below signal (bearish)
**Divergence Signals:**
- **Green Triangle ▲** = Bullish divergence detected
- Price is lower, but MACD momentum is strengthening
- Look for uptrend reversal
- Confirm with higher closes or volume
- **Red Triangle ▼** = Bearish divergence detected
- Price is higher, but MACD momentum is weakening
- Look for downtrend reversal
- Confirm with lower closes or selling volume
---
## Parameters & Settings
### MACD Fast Length (Default: 12)
- Controls the faster moving average period
- **Lower values** → More responsive, more false signals
- **Higher values** → Smoother, fewer signals
- **Typical range**: 8-15
### MACD Slow Length (Default: 26)
- Controls the slower moving average period
- **Lower values** → Faster divergence detection
- **Higher values** → More reliable, fewer signals
- **Typical range**: 20-35
### Signal Smoothing (Default: 9)
- EMA period applied to MACD itself
- **Lower values** → Faster crossover signals
- **Higher values** → Fewer false crossovers
- **Typical range**: 5-15
### Min Divergence Strength (Default: 0.5%)
- Minimum % difference between current MACD and swing MACD
- **Lower values** → More divergence signals (noisier)
- **Higher values** → Only strong divergences (fewer signals)
- **Recommended**: 0.3% - 1.0%
### Lookback Bars (Default: 75)
- Historical window for analysis
- Larger lookback = more context but slower calculation
- **Typical range**: 50-100
---
## Trading Strategy
### Bullish Divergence (Entry Setup)
1. **Identify Signal**: Green triangle appears on MACD
2. **Confirm Price**: Look for price rejection of the low (bounce)
3. **Volume Check**: Buy on increase in volume at the bounce
4. **Entry**: Above the swing low level
5. **Stop Loss**: Below the most recent swing low
6. **Target**: Next swing high or resistance level
### Bearish Divergence (Entry Setup)
1. **Identify Signal**: Red triangle appears on MACD
2. **Confirm Price**: Look for price rejection of the high
3. **Volume Check**: Sell on increase in volume at rejection
4. **Entry**: Below the swing high level
5. **Stop Loss**: Above the most recent swing high
6. **Target**: Next swing low or support level
### Risk Management
- **Position Size**: Risk only 1-2% per trade
- **Stop Loss**: Place beyond recent swings
- **Take Profit**: Scale out at 1:1, 1:2, 1:3 risk-reward ratios
- **Filter**: Use on higher timeframes (4H, Daily) for reliability
---
## Timeframe Recommendations
| Timeframe | Best For | Signal Quality |
|-----------|----------|---|
| **1H** | Scalping, day trading | Moderate (some noise) |
| **4H** | Swing trading | Excellent |
| **Daily** | Position trading | Excellent |
| **Weekly** | Long-term trends | Excellent |
---
## Tips & Best Practices
### ✅ DO:
- **Use on trends**: Divergences work best when there's a clear trend
- **Combine signals**: Look for confirmation from price action, volume, or moving averages
- **Trade the bounce**: Wait for price to react to the swing, then enter
- **Adjust parameters**: Test different MACD lengths for your trading style
- **Use alerts**: Set up mobile alerts so you don't miss signals
### ❌ DON'T:
- **Trade every signal**: Some signals are stronger than others
- **Trade flat/choppy markets**: Divergences fail in ranging markets
- **Ignore support/resistance**: Trade divergences near key levels for best results
- **Over-leverage**: Divergences are probabilistic, not guaranteed
- **Disable volume analysis**: Always check volume when divergence fires
---
## Advanced Features
### Volume Weighting
The indicator uses **volume-weighted MACD** instead of standard MACD. This means:
- High-volume reversals get more emphasis
- Low-volume moves are smoothed out
- More accurate momentum readings
- Better at identifying true trend changes
### Array Tracking
The indicator tracks the last 5 swings in arrays:
- `swingLows ` = last 5 price lows
- `swingHighs ` = last 5 price highs
- `swingMacds ` = corresponding MACD values
This allows detection of **hidden divergences** not visible in traditional analysis.
---
## Common Questions
**Q: Why didn't the indicator trigger a signal when I see a divergence?**
A: The indicator may require:
- MACD histogram to cross the zero line (confirms momentum shift)
- Minimum strength threshold to be met (adjust Min Divergence Strength)
- At least 5 swings to be recorded in the lookback window
**Q: Can I use this on all timeframes?**
A: Yes, but divergences are more reliable on higher timeframes (4H+). Lower timeframes produce more signals but with more noise.
**Q: Should I trade every green/red triangle?**
A: No. Use them as a heads-up for potential reversals. Always confirm with:
- Price action (rejection of the swing)
- Volume (increasing volume at reversal)
- Key support/resistance levels
**Q: How do I set alerts?**
A:
1. Right-click the indicator → Edit Alerts
2. Check "Bullish Divergence" and/or "Bearish Divergence"
3. Choose notification type (browser, mobile, email)
4. Set frequency to "Once per bar close"
**Q: What's the difference between regular and hidden divergence?**
A: This indicator detects **hidden divergences** (also called continuation divergences):
- **Regular**: Price makes new extreme, but oscillator doesn't
- **Hidden**: Price makes new extreme, oscillator makes new extreme in different direction
- Hidden divergences are often more reliable for continuation plays
---
## Disclaimer
This indicator is provided for educational and informational purposes only. It is not financial advice. Past performance does not guarantee future results. Always use proper risk management and combine with other analysis methods. Trading and investing carry risk of loss. Do your own research before making trading decisions.
---
## Support & Updates
For issues, feature requests, or questions:
- Check the indicator settings and parameter values
- Test on historical data first before live trading
- Adjust parameters to match your trading style and timeframe
---
**Version**: 1.0
**Last Updated**: November 2025
**Compatible**: TradingView v6+

MACD DivergencesUpdate of MACD indicator which shows the most recent, and developing, price action divergences with the histogram.

Macd Divergence + MTF EMA MACD Divergence + Multi Time Frame EMA
This Strategy uses 3 indicators: the Macd and two emas in different time frames
The configuration of the strategy is:
Macd standar configuration (12, 26, 9) in 1H resolution
10 periods ema, in 1H resolution
5 periods ema, in 15 minutes resolution
We use the two emas to filter for long and short positions.
If 15 minutes ema is above 1H ema, we look for long positions
If 15 minutes ema is below 1H ema, we look for short positions
We can use an aditional filter using a 100 days ema, so when the 15' and 1H emas are above the daily ema we take long positions
Using this filter improves the strategy
We wait for Macd indicator to form a divergence between histogram and price
If we have a bullish divergence, and 15 minutes ema is above 1H ema, we wait for macd line to cross above signal line and we open a long position
If we have a bearish divergence, and 15 minutes ema is below 1H ema, we wait for macd line to cross below signal line and we open a short position
We close both position after a cross in the oposite direction of macd line and signal line
Also we can configure a Take profit parameter and a trailing stop loss

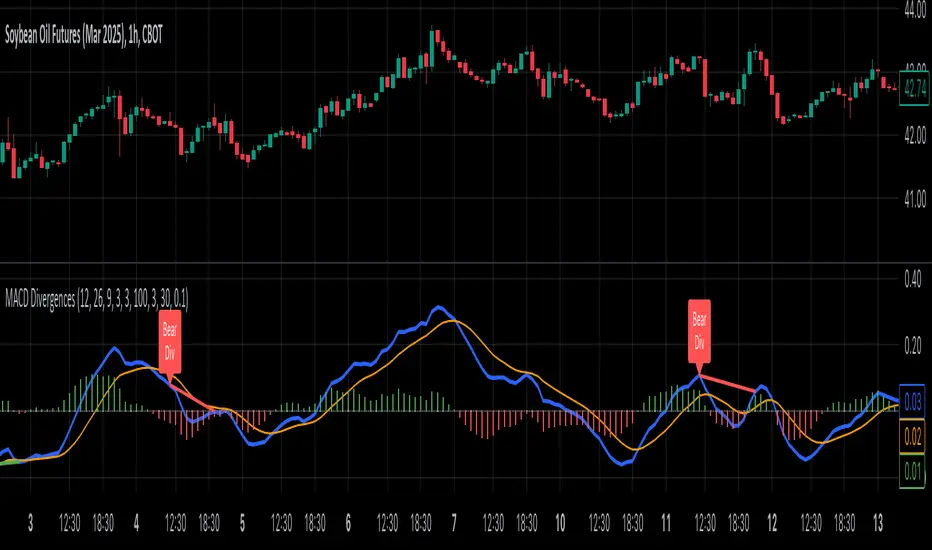
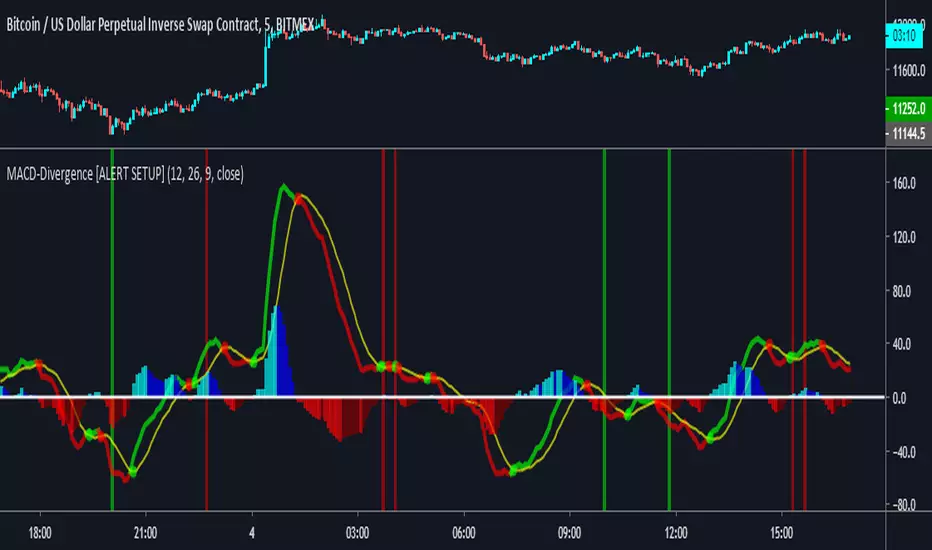
MACD Divergence [ALERTSETUP]A request I thought would be useful to code.
Very simple script that allows to create alerts on MACD divergences, based on @wanliyu script.
I also removed the security function to avoid repainting.
Red background is bearish divergence and green background is bullish divergence.
Enjoy !
MACD + Divergence Indicator [Dynamic Filter]Title: MACD + Divergence
Description: This is an enhanced momentum analysis suite based on the classic Moving Average Convergence Divergence (MACD). It addresses the common weakness of the standard MACD—false signals during low-volatility consolidation—by integrating a Dynamic Volatility Filter and a Multi-Timeframe (MTF) Dashboard.
The Problem It Solves: Standard MACD indicators often generate "whipsaw" crossovers when the market is ranging (moving sideways). Traders often struggle to identify these consolidation zones until it is too late. This script solves this by calculating a dynamic "Consolidation Zone" based on Standard Deviation, visually warning traders when momentum is too weak to be reliable.
Key Features:
1. Dynamic Consolidation Filter (The Grey Zone)
The script calculates Upper and Lower bands around the MACD line using Standard Deviation (Volatility).
Grey Fill: When the MACD line is inside the grey bands, the market is in a "Squeeze" or low-volatility consolidation. Crossovers in this zone are often lower probability.
Breakout: When the MACD line exits the bands, it indicates a volatility expansion and a potentially stronger trend.
2. Automated Divergence Detection
Automatically scans for both Regular (Reversal) and Hidden (Continuation) divergences between Price and Momentum.
Bullish: Marked with Green lines/labels.
Bearish: Marked with Red lines/labels.
Customization: You can choose to calculate divergence based on the MACD Line or the Histogram via settings.
3. Multi-Timeframe (MTF) Dashboard
A customizable information table (optional) displays the MACD state across 4 different timeframes (e.g., 15m, 1H, 4H, Daily).
It checks for Trend Alignment (e.g., are all timeframes Bullish?) to help you trade in the direction of the higher timeframes.
4. Enhanced Visuals
4-Color Histogram: Visualizes momentum growing (bright) vs. momentum fading (pale) for both bullish and bearish phases.
Line Highlights: The MACD and Signal lines are clearly distinct, with configurable smoothing options (EMA/SMA).
Settings Guide:
Consolidation Filter: Increase the Dynamic Filter Multiplier (Default: 0.5) to widen the grey zone if you want to filter out more noise.
Oscillator Source: Switch between "MACD Line" or "Histogram" for divergence detection depending on your strategy.
Table: You can toggle the dashboard on/off or change its position to fit your chart layout.
Credits: Base MACD logic derived from standard technical analysis concepts. Dynamic filtering logic adapted from volatility band theories.

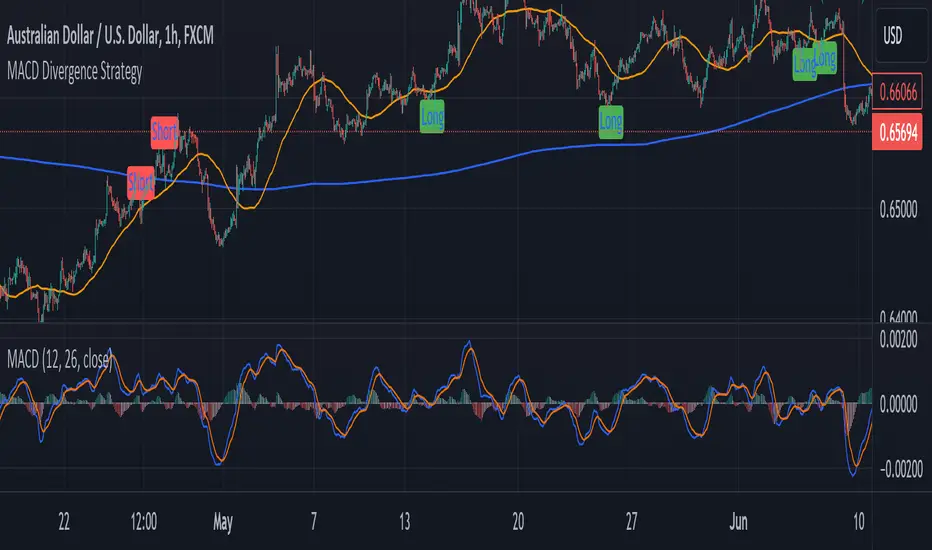
MACD Divergence StrategyStrategy Description: MACD Divergence with SMA Crossover Strategy
Overview:
The MACD Divergence with SMA Crossover Strategy is designed to identify high-probability trading opportunities based on the interaction of the MACD (Moving Average Convergence Divergence) indicator and key moving averages. This strategy focuses on detecting divergences between the MACD line and the signal line, combined with specific conditions related to the 50-period and 800-period SMAs. It ensures that the MACD and signal lines do not cross the zero line between the current and previous divergence points, thereby filtering out weaker signals and enhancing the accuracy of trade entries.
Key Components:
Simple Moving Averages (SMAs):
50-period SMA: A short-term trend indicator that helps identify the prevailing market direction.
800-period SMA: A long-term trend indicator used to gauge the overall market trend.
MACD Indicator:
MACD Line: Represents the difference between the 12-period EMA and the 26-period EMA.
Signal Line: A 9-period EMA of the MACD line.
Histogram: The difference between the MACD line and the signal line, used to visualize the strength of the signal.
Trade Conditions:
Long Position (Buy):
The 50 SMA is above the 800 SMA, indicating a bullish market trend.
The MACD line and signal line are both below zero, signifying a potential bullish reversal.
A bullish divergence is detected when the MACD line crosses above the signal line below zero, without either line crossing the zero level between the current and previous cross.
Short Position (Sell):
The 50 SMA is below the 800 SMA, indicating a bearish market trend.
The MACD line and signal line are both above zero, signaling a potential bearish reversal.
A bearish divergence is detected when the MACD line crosses below the signal line above zero, without either line crossing the zero level between the current and previous cross.
Signal Plotting:
Long Signals: Displayed when the conditions for a bullish divergence and SMA alignment are met, marked with a green upward arrow on the chart.
Short Signals: Displayed when the conditions for a bearish divergence and SMA alignment are met, marked with a red downward arrow on the chart.
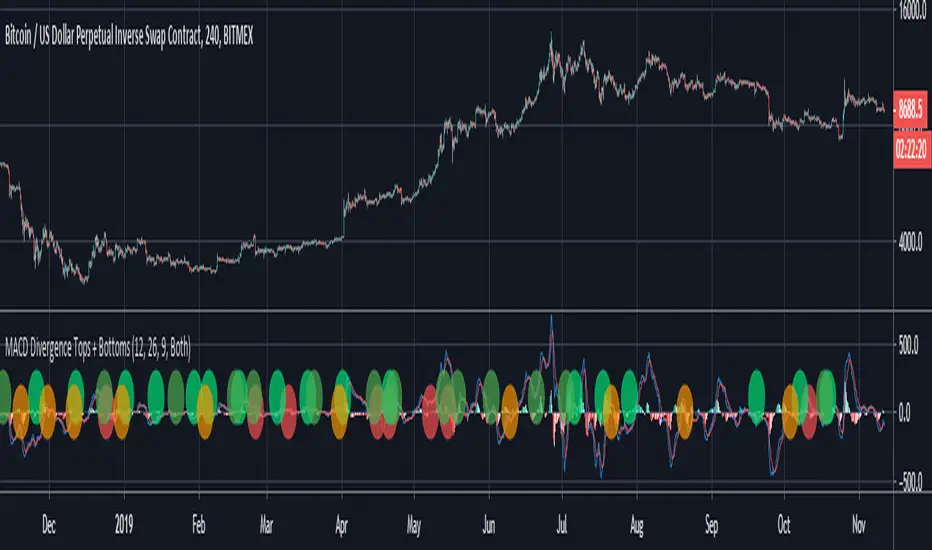
MACD Divergence Tops + BottomsMACD Indicator which plots local peaks and troughs in divergence.
"Classic" Divergence is specified as:
- A higher price, with reduced MACD high --> Potential Sell Point
- A lower price, with higher MACD low --> Potential Buy Point
"Alternative" Divergence is specified as:
- A higher MACD high, with reduced price --> Potential Sell Point
- A lower MACD low, with higher price --> Potential Buy Point
MACD Divergence should be used in combination with other indicators. This indicator identifies local tops and bottoms, with potential for macro trend shifts.
MACD Divergence +This study plots MACD Divergences and has the option of plotting a Top Dog Trading - MOM and DAD Version of the MACD
MACD Histogram and outline change color when increasing or decreasing above or below the zero-line,
Background also changes color according to MACD Line cross of Signal Line and 0 line or The Direction of DAD
Plenty of Alerts so that you dont have to stare at the screen all day

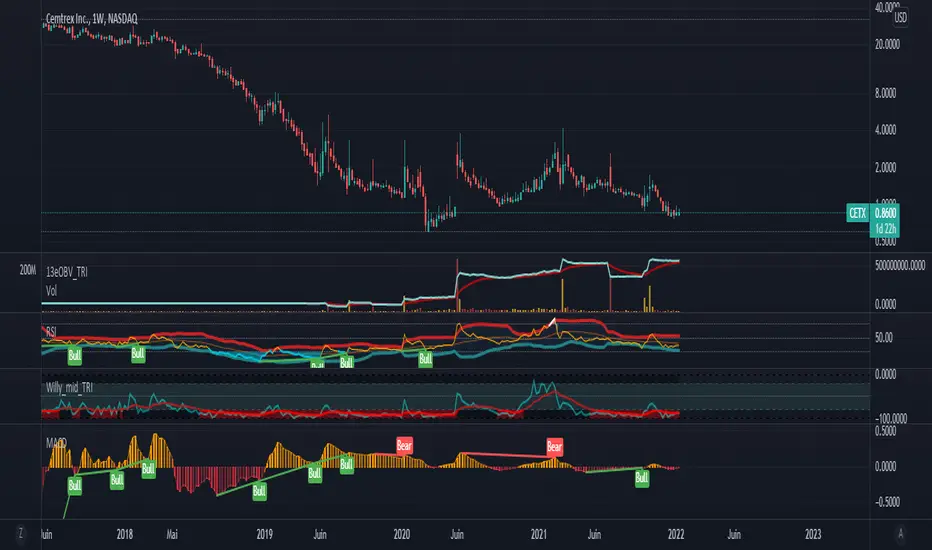
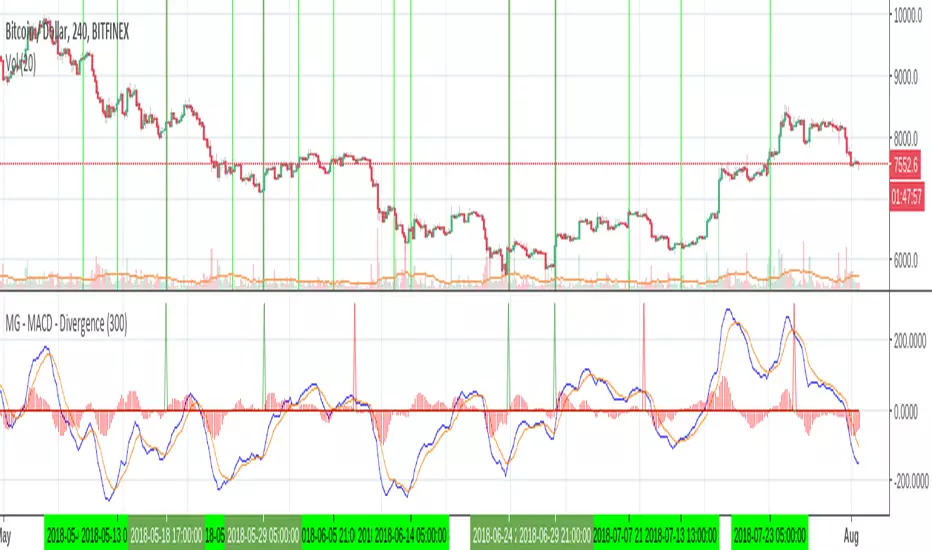
MG - MACD - Divergence - 1.0The MACD indicator can produce some powerful divergence signals which can be useful confirmation for entering / exiting a trade.
This indicator generates and alert and plots (if enabled), when a divergence is detected. For example, if bullish (above zero) and two bearish MACD crosses are detected with the second being lower than the first, a bearish divergence alert is triggered. Theoretically a good place to take profit / possibly enter a short position if you have further confirmation.
Can also be configured to include continuation signals i.e. a bullish trend with two bullish MACD crosses where the second is higher than the first. This could indicate more bullish action ahead.
In order to illustrate how this indicator helps to sift out a good amount of false signals, I have highlighted in the above image in dark green, all of the divergence buy signals highlighted by the indicator and in light green, the rest of the MACD buy signals.
Macd Divergence with higher timeframe trendThis script Uses Ma`s for Trend confluence and looks for macd divergence where the macd is below the Zero line on a long and doesnt cross back up before the divergence happens.
Also added Tp as preeset 2:1RR in green. SL in red and 1:1 RR in orange.
Alerts are included too.
MACD Divergence added in CM_MacD_Ult_MTFYou must have missed some trading opportunities of MACD Divergence due to oversight. So I create and share this script to help u seize the chances.
This indicator is based on CM_MacD_Ult_MTF created by ChrisMoody.

RSI and MACD Divergence IndicatorThe RSI and MACD Divergence Indicator is a custom Pine Script v6 indicator designed for TradingView that identifies and visualizes divergences between price movements and two technical indicators: the Relative Strength Index (RSI) and the Moving Average Convergence Divergence (MACD). Here's a brief explanation of its functionality:
Divergence Detection: The indicator detects both regular and hidden divergences for RSI, MACD (MACD Line), and Histogram. Regular bullish divergences occur when price makes a lower low but the indicator makes a higher low (suggesting a potential reversal upward), while regular bearish divergences occur when price makes a higher high but the indicator makes a lower high (suggesting a potential reversal downward). Hidden divergences indicate continuation patterns (e.g., higher low in price with a lower low in the indicator for bullish continuation).
Customizable Inputs:
Pivot Bars: Sets the number of bars used to confirm pivot highs and lows (default: 5).
RSI and MACD Parameters: Allows adjustment of RSI length (default: 14) and MACD settings (fast: 12, slow: 26, signal: 9).
Toggle Options: Enables/disables detection of regular and hidden divergences for RSI, MACD, and Histogram individually.
Confirmation: Option to wait for pivot confirmation (default: true), delaying divergence display until the pivot is fully formed.
Show Only Last Divergence: Toggles between showing only the most recent divergence (default: true) or all detected divergences (false), with previous lines and labels cleared when true.
Minimum Divergences: Sets the minimum number of divergence types required at a pivot to display (default: 1, max: 6).
Maximum Pivot Points: Limits the number of historical pivot points to check (default: 10).
Maximum Bars to Check: Restricts analysis to the last specified number of bars (default: 500).
Visualization:
Draws lines connecting the price pivot points where divergences are detected, with customizable colors, widths, and styles (solid, dashed, dotted) for RSI and MACD.
Displays a single label per pivot with vertically stacked text listing all detected divergence types (e.g., "RSI Bull Div\nMACD Bull Div"), using semi-transparent backgrounds (green for bullish, red for bearish) and white text.

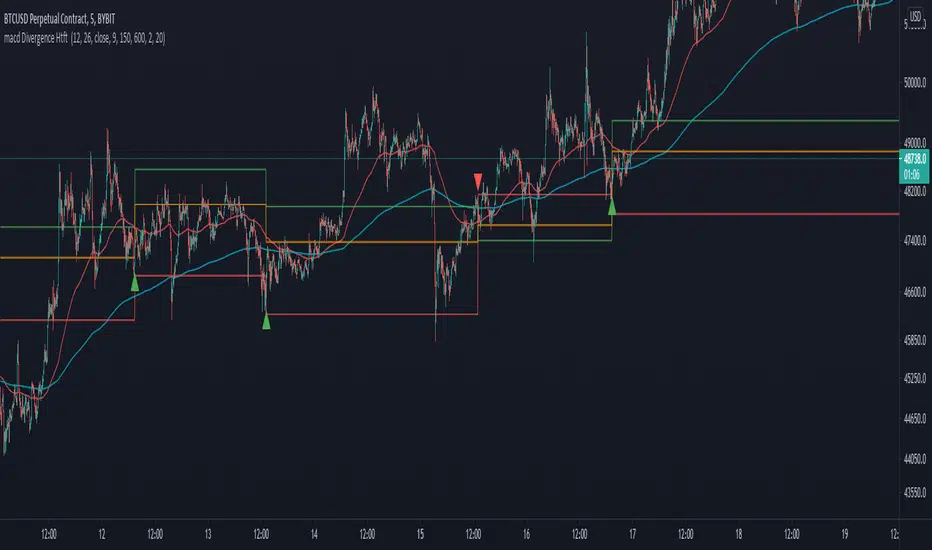
Digital MACD Divergences MTF [LUPEN]Digital MACD Divergences MTF V1.0
Overview:
Digital MACD Divergences MTF is an advanced momentum oscillator based on digital signal processing techniques.
Instead of relying on traditional moving-average smoothing, it applies Finite Impulse Response (FIR) digital filters to extract momentum more cleanly, reducing lag and short-term market noise.
The indicator is designed to provide a clear visualization of momentum structure, divergence behavior, and multi-timeframe context, rather than discrete trading signals.
Conceptual Architecture
At its core, the indicator reinterprets the classic MACD framework through digital convolution logic:
FIR filters are used to compute momentum in a more responsive and stable manner than standard EMA-based MACD.
The resulting histogram represents momentum intensity and direction as a continuous state rather than binary conditions.
A digitally smoothed signal line provides structural reference without introducing excessive delay.
This approach emphasizes momentum quality and structure, not signal frequency.
Divergence Detection Logic:
The script includes automatic divergence detection based on pivot analysis:
Regular bullish and bearish divergences are identified using confirmed pivot points.
Divergences are visualized with explicit line structures and optional filled areas, highlighting the zone of disagreement between price behavior and momentum.
The visualization is designed to remain readable without obscuring price action.
Divergences are presented as contextual information, not as mandatory actions.
Multi-Timeframe (MTF) Context
Digital MACD Divergences MTF supports native multi-timeframe analysis through a dual-pane workflow:
A lower-timeframe instance visualizes local momentum dynamics.
A higher-timeframe instance visualizes the broader momentum regime within which lower-timeframe fluctuations occur.
The higher-timeframe view is not intended as confirmation or filtering logic, but as a contextual background layer that helps interpret short-term momentum behavior inside a larger structural environment.
This separation avoids decision compression and keeps each timeframe’s role conceptually distinct.
Visual Design
Gradient-based histogram fills represent momentum intensity in a continuous manner.
Positive and negative momentum regions are clearly differentiated while remaining adaptable to both dark and light chart themes.
All visual elements are designed to emphasize state and regime, not discrete events.
Reliability
No repainting: all divergences and momentum states are confirmed on candle close and remain fixed.
Designed for consistency across instruments and timeframes.
Customization Options
Timeframe selection for MTF mode (leave empty to use the chart’s timeframe).
Adjustable signal smoothing parameters.
Divergence visibility controls, pivot sensitivity, and optional divergence fill.
Fully customizable color palette.
Usage Notes
This indicator is a visual market analysis tool intended to support momentum interpretation and structural context.
It does not provide investment advice, trading signals, or automated decision logic, and should be used as part of a broader analytical framework.
Final quotes:
"Trading is not about prediction, but about understanding momentum structure.
Digital MACD removes noise to make that structure visible."

Smart MACD Divergence ScannerOriginal Base Indicator: "CM_MacD_Ult_MTF" by ChrisMoody
This indicator builds upon ChrisMoody's excellent multi-timeframe MACD foundation and transforms it into a professional divergence scanner with advanced quality assessment and filtering capabilities. The original MACD visualization and MTF functionality have been preserved while adding completely new divergence detection, scoring, and filtering systems.
🎯 What Makes This Indicator Unique:
Smart MACD Divergence Scanner is a professional tool for detecting MACD-based divergences with an advanced filtering system and signal quality assessment. Unlike standard divergence indicators, this version includes innovative features:
Adaptive Quality Scoring System — each signal receives a score from 0 to 100 based on multiple factors
Volatility Filter — automatic signal suppression during low market volatility periods
Multi-Timeframe Confirmation — divergence verification on higher timeframe for increased reliability
Divergence Strength Analysis — calculation of percentage difference between price and indicator movement
Information Dashboard — detailed real-time signal statistics
Cooldown System — prevention of multiple consecutive signals
💡 How It Works:
The indicator uses the classic divergence concept — the divergence between price movement and the MACD oscillator. However, instead of simple pivot detection, the algorithm:
Scans the market for local extremes (pivots) on price and MACD histogram
Searches for divergences — when price updates low/high while MACD shows opposite movement
Assesses quality — analyzes divergence strength, volatility, higher timeframe confirmation
Filters noise — eliminates weak signals through threshold system and cooldown
Generates signal — only when all quality criteria are met
🔧 Key Parameters:
MACD Settings: Fast Length (12), Slow Length (26), Signal Length (9)
Divergence Detection: Pivot Lookback (5), Max Lookback Range (60), Min Divergence Strength (15%)
Quality Filters: Min Quality Score (60), Volatility Filter, MTF Confirmation, Signal Cooldown (5)
📊 How to Use:
Add indicator to chart — it will automatically start scanning
Configure filters — start with default settings, then adapt to your trading style
Watch for signals: 🟢 Green "BUY" label = bullish divergence, 🔴 Red "SELL" label = bearish divergence
Check quality score on labels (Q: XX)
Use information panel to monitor statistics and current market conditions
⚙️ Settings Guide:
For swing trading (4H-Daily): Increase Pivot Lookback to 7-10, set Min Quality Score to 70+
For day trading (15m-1H): Keep default settings, enable all filters
For scalping (1m-5m): Decrease Min Quality Score to 50, disable MTF Confirmation
For volatile markets (crypto): Increase Min Divergence Strength to 20-25%, enable Volatility Filter
⚠️ Important Notes:
Divergences are probabilistic signals, not guaranteed reversals
Use additional confirmation (support/resistance levels, volume, price action)
Adjust parameters for specific asset and timeframe
Signals appear with Pivot Lookback bars delay (retrospective confirmation)
On volatile markets, increase Min Quality Score to reduce false signals

Cycle Forecast + MACD Divergence (Kombi v6 FULL)This indicator merges two powerful analytical models:
🔮 1. Dominant Cycle Forecasting
The script automatically identifies major structural market cycles by detecting significant swing highs and lows.
It then fits a sinusoidal wave (amplitude, phase, and period) to the dominant cycle and projects it into the future.
Features:
Automatically extracts large, dominant cycles (no noise, no small swings)
Smooth sinusoidal historical cycle visualization
Future cycle projection for 1–2 upcoming cycle periods
Dynamic amplitude and phase alignment based on market structure
Helps anticipate cycle tops and bottoms for long-term timing
📉 2. MACD Divergence Detection
Full divergence detection engine using MACD or MACD Histogram.
Detects:
Bullish Divergence
Price ↓ while MACD (or Histogram) ↑
→ Possible trend reversal upward
Bearish Divergence
Price ↑ while MACD (or Histogram) ↓
→ Possible trend reversal downward
Features:
Pivot-based divergence confirmation (no repaint)
Choice of MACD Line or Histogram as divergence source
Labels + connecting divergence lines
Works across all markets and timeframes
⚙️ Smart Auto-Pivot System
The indicator optionally adjusts pivot sensitivity based on timeframe:
Weekly → tighter pivots
Daily → medium pivots
Intraday → wider pivots
Ensures stable, meaningful divergence signals even on higher timeframes.
🎯 Use cases
Identify upcoming cycle highs/lows
Spot major trend reversals early
Improve swing entries with MACD divergences near cycle turns
Combine forecasting with momentum exhaustion
Suitable for crypto, stocks, indices, forex & commodities
🧠 Why this indicator is powerful
This tool blends time-based cycle forecasting with momentum-based divergence signals, giving you a unique perspective of where the market is likely to turn.
Cycles reveal when a move may occur.
Divergences reveal why a move may occur.
Combined, they offer highly effective market timing.

Combined ATPC & MACD DivergenceTrend Optimizer + Divergence Finder in One Unified Tool
🔍 Overview:
This powerful dual-system indicator merges two proven analytical engines:
✅ The Algorganic Typical Price Channel (ATPC) — a custom trend oscillator that highlights mean-reversion and directional bias.
✅ A refined MACD system with divergence detection, enhanced with an adjusted Donchian midline for real-time trend strength filtering.
Together, they provide a high-confidence, multi-signal system ideal for swing trading, scalping, or confirming reversals with context.
⚙️ Core Components & Logic
🧠 1. ATPC Engine (Trend Commodity Index)
A momentum and volatility-normalized oscillator based on the typical price (H+L+C)/3:
TrendCI Line (Blue) – Main trend signal based on smoothed CCI logic.
TrendLine2 (Orange) – A slower smoothing of TrendCI for crossovers.
Key Zones (customizable):
🔴 Ultra Overbought: +73
🟣 Overbought: +58
🟣 Oversold: -58
🔴 Ultra Oversold: -73
Trade Logic:
✅ Buy Signal: TrendCI crosses above TrendLine2 while in oversold zone
❌ Sell Signal: TrendCI crosses below TrendLine2 while in overbought zone
Additional visual feedback:
Histogram Bars show strength and direction of momentum shift
Green/Red Circles highlight potential long/short setups
📉 2. MACD System + Divergence Finder
Classic MACD enhanced with a Donchian Midline overlay to filter trend bias.
🔷 MACD Line and 🟠 Signal Line show crossover momentum
🟩/🟥 Histogram shows distance from the signal line
🟪 Adjusted Donchian Midline dynamically adapts to range-bound vs trending environments
Background Color provides real-time trend state:
✅ Green = Bullish Trend
❌ Red = Bearish Trend
No color = Neutral / Choppy
MACD Boundaries (user-defined):
Overbought: +1.0
Oversold: -1.0
🔀 3. Divergence Detection
Spot hidden power shifts before price reacts:
🔼 Positive Divergence – Price makes lower lows, but MACD histogram rises
🔽 Negative Divergence – Price makes higher highs, but MACD histogram weakens
These are visually marked with:
Green “+Div” label (bullish reversal cue)
Red “–Div” label (bearish exhaustion signal)
🎯 How to Use It
For Trend Traders:
Stay in sync with macro trend using MACD histogram + background
Use ATPC crossovers for precision entries
Avoid signals during neutral background (chop filter)
For Reversal Traders:
Look for bullish +Div with ATPC buy signal in oversold zone
Look for bearish –Div with ATPC sell signal in overbought zone
Mid-Donchian line can act as confluence or breakout trigger
For Scalpers & Intraday Traders:
Combine with VWAP, liquidity zones, or order flow levels
ATPC crossovers + MACD histogram zero-line flip = potential scalp entry
Use histogram slope and divergence to avoid false momentum traps
🧩 Customizable Inputs
🎛️ ATPC: Channel & Smoothing lengths, overbought/oversold thresholds
🎛️ MACD: Fast/slow EMAs, signal smoothing, Donchian period, bounds
🎨 Fully theme-compatible with adjustable colors and line styles
🔔 Alerts (Add Your Own)
While this version doesn’t contain built-in alerts, you can easily add alerts based on:
buySignal or sellSignal from ATPC logic
Histogram cross zero or trend flip
MACD Divergence event
📜 “This indicator doesn't just show signals—it tells a story about who’s in control of the market, and when that control might be slipping.”

MACD Divergence auto displayed on chart, with alertsMACD Pivot Divergence Detector
This tool identifies MACD histogram divergences based on confirmed pivot highs and lows.
Instead of comparing swing points on the MACD line, this script focuses specifically on the histogram, which measures momentum shifts between MACD and Signal.
How it works
The script detects confirmed pivots using a two-bar swing structure.
When price breaks above a previous pivot high, the script compares the MACD histogram value at that pivot to the current histogram value:
• If price makes a higher high while the histogram makes a lower high, a potential bearish divergence is marked.
The reverse logic is applied for bullish divergence when price breaks below a pivot low.
What makes this script unique
It uses pivot-confirmed histogram values, not lookback-based divergence.
It evaluates divergence only at actual highs/lows, reducing false positives.
It marks divergence directly on the candles for visual clarity.
Alert conditions are included for automated detection.
How to use
Bullish signals may highlight potential momentum loss in downtrends; bearish signals may highlight momentum loss near highs. Divergence does not guarantee reversal and should be combined with broader context, structure, or trend analysis.

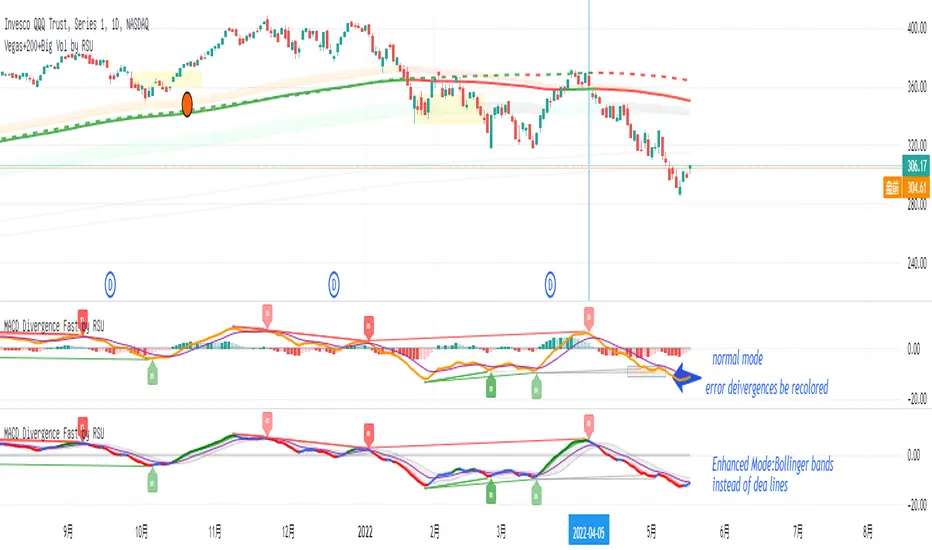
MACD Divergence Fast by RSUAdvantages:
1. When MACD-diff line(orange color) is at a high point, once it falls by 1 k line, it will detect the divergence from the previous high point. This can quickly find the divergence that has taken effect and help you quickly capture the trend before a sharp decline or rise.
2. This indicator detects the previous high and the previous low of 5, 10, 20, 40, 60 lengths at the same time, instead of only detecting a fixed length, so that more divergences can be found.
Notice:
Because it is a quick divergence detection, it is recommended to confirm that the divergence takes effect after the current k is completely closed first. I have identified this state in the indicator as "k not end".
Disadvantages and Risks:
Since it is a quick discovery, there will be error identification. Error divergences will recolor to grey.
Suggestion:
Use “RSI Divergence Fast by RSU” at the same time, because RSI divergence usually occurs before macd, if the position diverges at the same time, the probability of success will increase.
Please do not:
Don't go short in the uptrend, don't go long in the downtrend.
Top divergences that occur because of a strong uptrend are usually only temporary pullbacks. Bottom divergences in persistent declines are also temporary rallies. Do not attempt to trade such low-return trades.
It is recommended to use the divergence indicator when the stock price has made a new high and retraced, and once again made a new high, because this often leads to the end of the trend.
Divergence how to use:
1. After the previous K line was completely closed, a bottom divergence was found.
2. Open an long order at the beginning of the second bar, or as close to the bottom as possible (because the stop loss will be smaller).
3. Break the stop loss price below the previous low where the divergence occurred, which already means that the divergence is wrong.